Velocity Distribution Plot Analysis (Jee Mains) | ExamDuo
Ask Doubts
Log in
Gas Laws and Ideal Gas
Medium
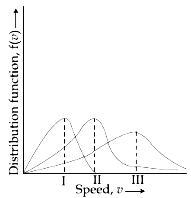
Velocity Distribution Plot Analysis
Points I, II and III in the following plot respectively correspond to
(
V
m
p
:
most
probale
velocity
:
)
Ask about this question
SELECT ONE OPTION
A
V
m
p
of
N
2
(
300
K
)
;
V
m
p
of
O
2
(
400
K
)
;
V
m
p
of
H
2
(
300
K
)
B
V
m
p
of
N
2
(
300
K
)
;
V
m
p
of
H
2
(
300
K
)
;
V
m
p
of
O
2
(
400
K
)
C
V
m
p
of
H
2
(
300
K
)
;
V
m
p
of
N
2
(
300
K
)
;
V
m
p
of
O
2
(
400
K
)
D
V
m
p
of
O
2
(
400
K
)
;
V
m
p
of
N
2
(
300
K
)
;
V
m
p
of
H
2
(
300
K
)
Check