Temperature & Thermal Expansion
Medium
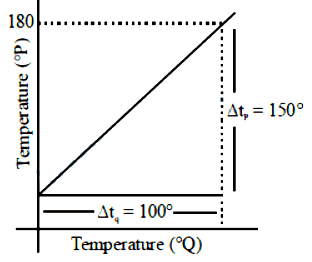
Temperature Scale Conversion Graph
The graph between two temperature scales P Q P Q
SELECT ONE OPTION