Newton's laws of motion
Medium
Momentum-Time Curve Force Analysis
The figure represents the momentum time ( p − t )
If( t 3 − t 2 ) < t 1
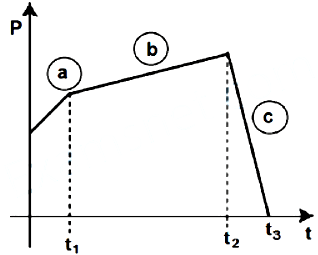
If