CAT 2008
Tables and Caselets
Hard
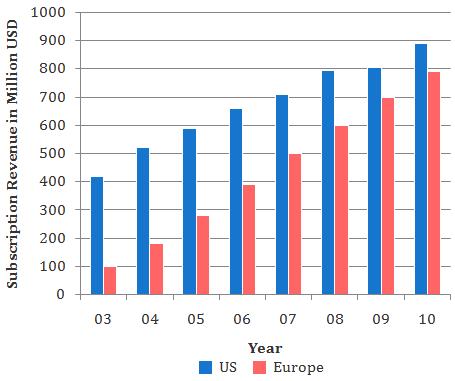
Internet Service Revenue US Europe - I
Answer the following question based on the information given below.
The bar chart below shows the revenue received, in million US Dollars (USD), from subscribers to a particular Internet service. The data covers the period 2003 to 2007 for the United States (US) and Europe. The bar chart also shows the estimated revenues from subscription to this service for the period 2008 to 2010.
In 2003, sixty percent of subscribers in Europe were men. Given that woman subscribers increase at the rate of 10 percent per annum and men at the rate of 5 percent per annum, what is the approximate percentage growth of subscribers between 2003 and 2010 in Europe? The subscription prices are volatile and may change each year.
SELECT ONE OPTION